


Solana price has confirmed a bullish market structure shift after breaking a key lower-high sequence, with price action now positioning for a continuation toward $156.
Summary
- Solana has broken its bearish lower-high structure
- A pullback toward the 0.618 Fibonacci is key for higher-low confirmation
- A confirmed continuation opens upside toward $156 resistance
Solana’s (SOL) recent price action marks an important technical development, as the market has transitioned away from its prior bearish structure and into a newly established bullish phase. After months of lower highs and corrective rallies, Solana has now delivered an impulsive move that breaks the descending structure and signals a shift in control back toward buyers.
Solana price key technical points
- Solana has broken its lower-high projection, confirming a structural shift
- Price established a new swing high near the value area high
- A pullback toward the 0.618 Fibonacci retracement is key for continuation toward $156 resistance
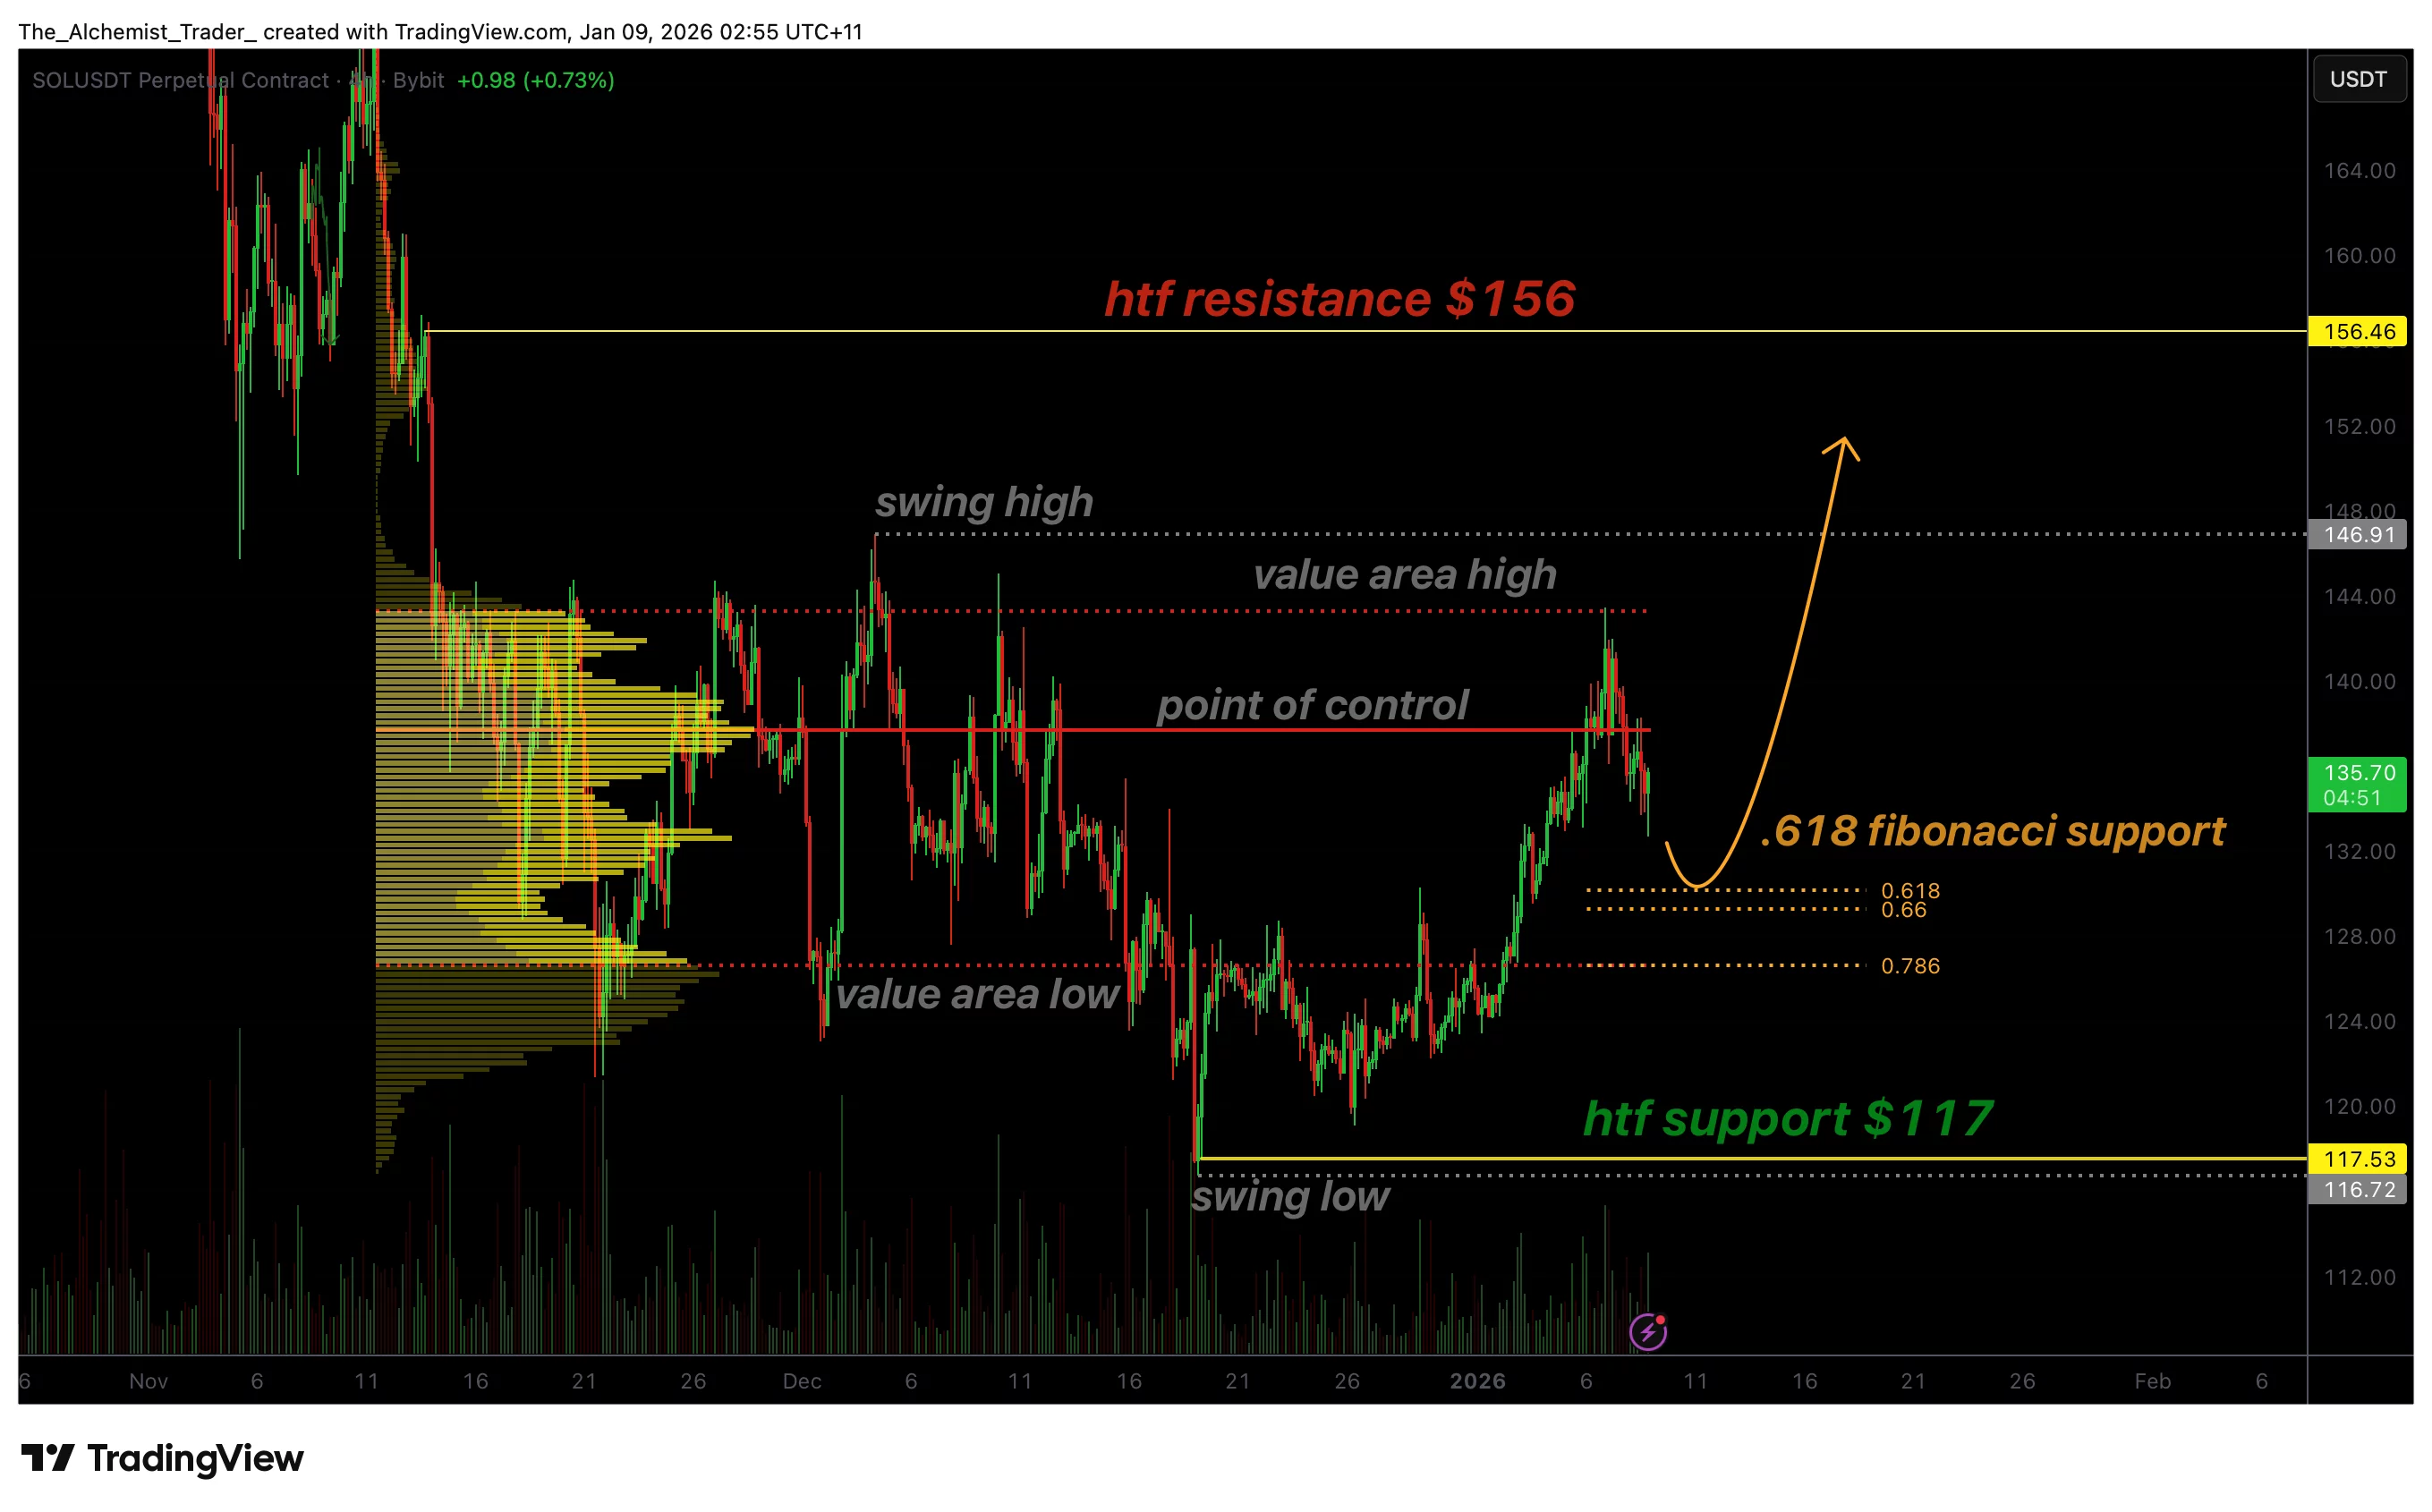
The most significant development in Solana’s chart is the break of the lower-high structure that previously defined its downtrend. This break occurred through an impulsive move, which is an important distinction, as impulsive price action often signals genuine strength rather than corrective noise.
Following this move, Solana established a new swing high around the value area high, confirming bullish intent. This shift alters the broader market structure, moving Solana away from a bearish framework and into a transitional phase where higher lows can begin to form.
However, a confirmed trend shift requires more than a single impulsive rally. The market must now demonstrate acceptance above key support levels and hold higher ground during any corrective pullbacks. This is where the current focus on the 0.618 Fibonacci retracement becomes critical.
Fibonacci retracement and higher-low formation
After impulsive expansions, markets often retrace to Fibonacci levels as part of a healthy continuation process. In Solana’s case, the 0.618 retracement represents a high-probability area where buyers may step in to defend price and establish a higher low.
It is important to note that intraday price action has slipped below the Point of Control, suggesting short-term rebalancing is taking place. However, this does not invalidate the bullish structure as long as price can stabilize above the 0.618 Fibonacci zone.
Holding this retracement level over the coming days and weeks would confirm that buyers remain in control and are willing to defend higher prices. A successful defense would complete the structural transition by confirming a higher low, which is a defining feature of bullish market structure.
Upside target and resistance outlook
Once a higher low is established, Solana’s next major upside target sits near the $156 region. This level represents a significant resistance zone on higher time frames and serves as a natural objective for the next leg of the rally.
A move toward $156 would confirm that the prior bearish structure has been fully negated and that Solana has transitioned into a sustained bullish trend. Until that target is tested, interim consolidation and pullbacks should be viewed as part of the continuation process rather than signs of weakness, provided key support levels hold.
Failure to defend the 0.618 retracement would delay the bullish thesis and raise the risk of further consolidation. However, unless price falls back below the broken structure, the broader bias remains constructive.
Solana price action: What to expect
In the near term, Solana is likely to continue consolidating as the market attempts to establish a higher low above the 0.618 Fibonacci retracement. This zone will be the most important level to monitor, as it will determine whether the bullish structure can fully develop.
A confirmed higher low would significantly increase the probability of continuation toward the $156 resistance level. Conversely, sustained acceptance below this zone would suggest that the market needs additional time to rebalance before resuming higher.