


BNB price surged back towards $650 as futures traders increasingly bet on further upside for the token.
Summary
- BNB rebounded from $627 to near $650 as improving risk sentiment followed easing U.S.-Iran tensions and a drop in crude oil prices.
- Futures activity strengthened, with open interest rising 6.5% to $923 million and a long-short ratio above 2.21, signaling bullish positioning.
- Technical setup remains positive, with price holding above an ascending trendline and a bullish SMA crossover pointing toward resistance near $685 and potentially $750.
After touching an intraday low of $627 on Sunday, BNB (BNB) price rebounded back to $646 at the last check on Monday morning, March 25.
BNB price rebounded in tandem with the broader crypto market as investor appetite for risk assets improved on hopes of peace between the U.S. and Iran. Notably, crude oil prices fell sharply back below $100 to trade around $87 per barrel as geopolitical tensions eased. Bitcoin (BTC) has climbed back above $71,000 while Ethereum (ETH) approached the $2,200 level.
The traditional market also seemed to catch a bid with Asian stocks, such as Japan’s Nikkei 225, the Hang Seng, and the Shanghai Composite, all posting gains.
On the derivatives market, traders have scaled up their bets on BNB, adding more liquidity to the ecosystem.
CoinGlass data show that open interest for BNB futures has increased by 6.5% to $923 million over the past 24 hours, with a long/short ratio of over 2.21 on the crypto exchange Binance. This indicates that market participants are overwhelmingly positioned for a breakout as bullish conviction reaches its highest point this month.
BNB’s price action on the daily chart presents a bullish outlook for the token over the coming sessions.
BNB price has rebounded above an ascending trendline that has been acting as a dynamic support for the token over multiple weeks. As long as BNB price remains above the support trendline, the overall structure remains firmly in the hands of the buyers.
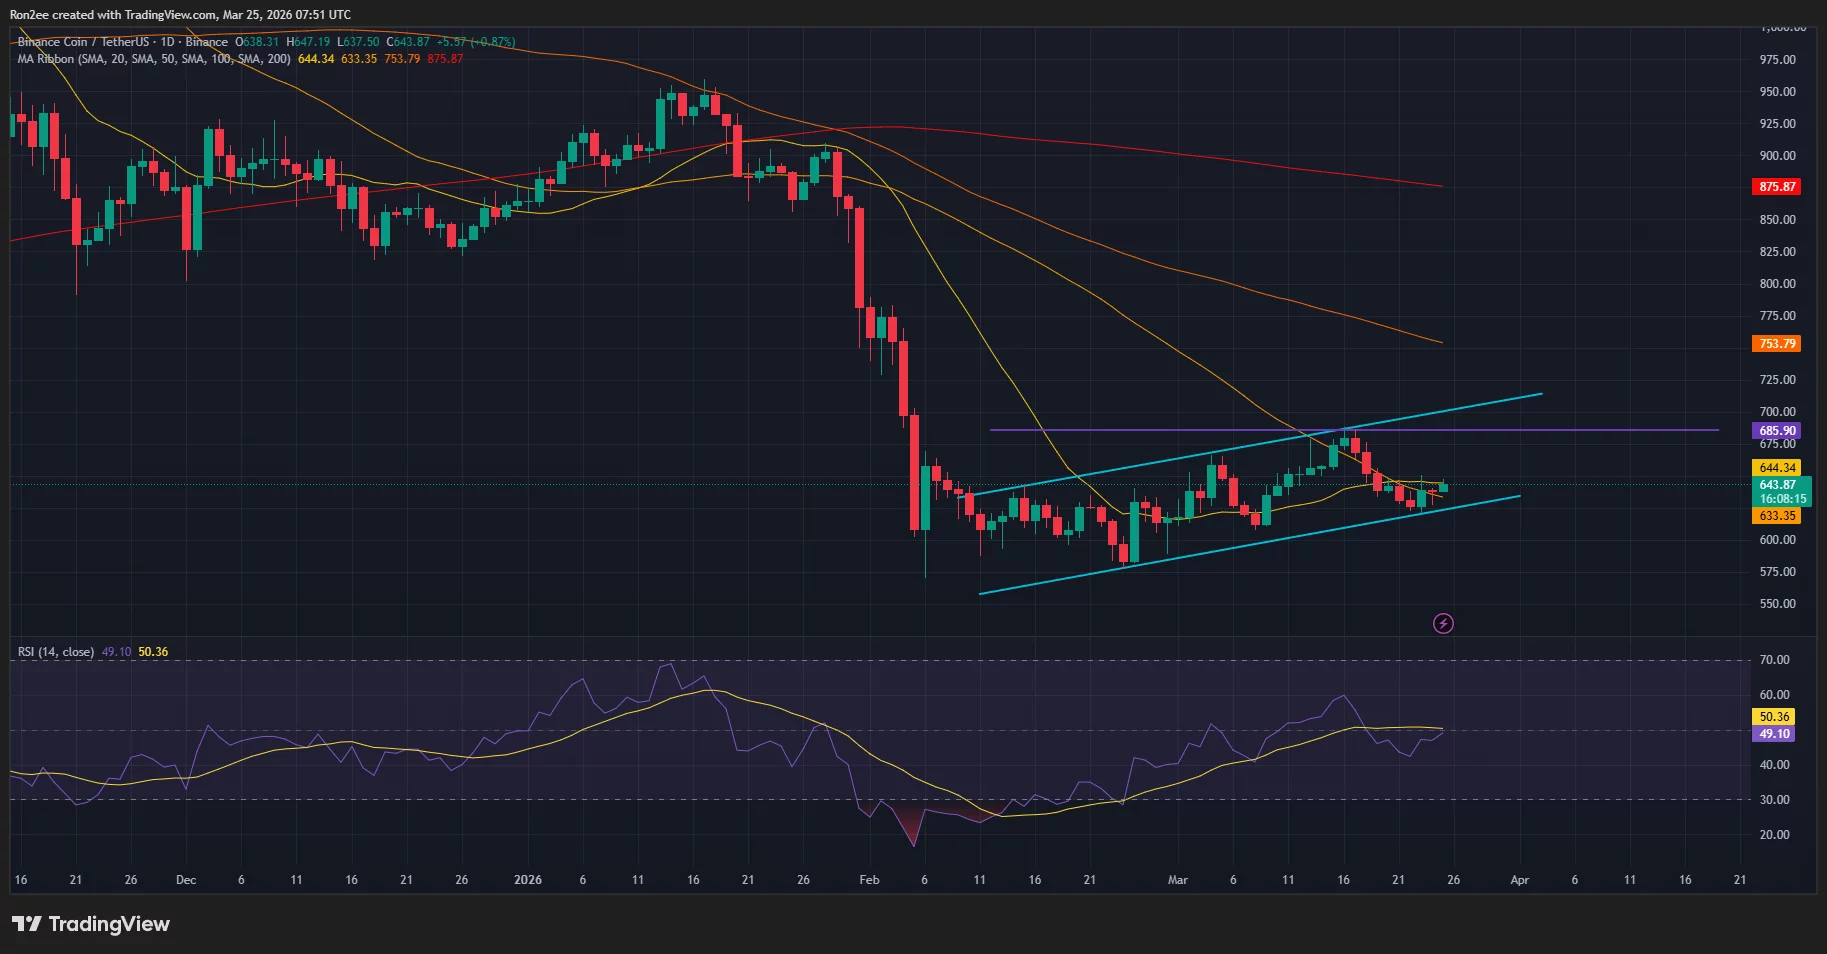
The trendline forms the lower boundary of an ascending parallel channel pattern, another popular bullish pattern in technical analysis.
Additionally, a look at technical indicators shows that bulls are regaining their momentum and control over the market. Notably, the 20-day SMA has formed a bullish crossover with the 50-day SMA, while the relative strength index is close to breaking above neutral levels to signal that the path of least resistance is now to the upside.
While this still means that volatility could persist, especially if the broader market sentiment improves as further details emerge over the potential peace negotiations between the U.S. and Iran, the outlook is promising.
For now, traders should keep an eye on $685 as the next key resistance level where BNB faced stiff rejection several times during its rally earlier this month.
A breach above the neckline could catapult the price towards the 100-day SMA above $750. On the contrary, if BNB price slips below the $600 support, it could invalidate the current bullish thesis and lead to a retest of lower demand zones.
Disclosure: This article does not represent investment advice. The content and materials featured on this page are for educational purposes only.